Standardized & Reproducible
All analysis pipelines are version-controlled, ensuring that your results are standardized and fully reproducible across your team and for peer review.
Cosmos-Hub allows researchers to create virtual cohorts for microbiome analysis using their study metadata. Simply upload any categorical or continuous metadata from your study via the software’s standard template and create virtual cohorts to compare against each other.
Cosmos-Hub provides a comprehensive, a cloud-based microbiome analysis toolbox that allows microbiome researchers to create virtual cohorts and perform rigorous data exploration in microbiome studies. Whether analyzing longitudinal data from human clinical trials or characterizing gut microbiome features from animal or environmental sources, our platform simplifies the complex process of integrating taxonomic profiles with study metadata. Simply upload any categorical or continuous metadata variables from your study via the software’s standard template and create virtual cohorts from a study or conduct a meta-analysis across multiple studies in just a few clicks.
Cosmos-Hub allows researchers to create virtual cohorts for microbiome analysis using their study metadata. Simply upload any categorical or continuous metadata from your study via the software’s standard template and create virtual cohorts to compare against each other.
There are two main ways in which users can create virtual cohorts and conduct statistical analysis.
The Cosmos-Hub dashboard allows users to easily navigate their studies, select the samples they'd like to include and conduct their downstream analysis using the statistics toolbox. By selecting folders advanced filtering, users can select samples via their folder paths but also sub-select samples based on metadata variables of their choosing such as 'number of reads', 'time point', 'treatment group' or any numerical or text metadata variable they've uploaded.
Don’t have data from additional studies? Use the Cosmos-Hub Atlas to incorporate new datasets into your study and increase the statistical power of your study.
Meta-Analysis*
One of the most powerful features of the Cosmos-Hub platform is the ability to create virtual cohorts using your study metadata, using advanced filtering. This allows users to conduct new studies, usng samples from multiple projects without having to collect new samples. Simply use tools like MaAsLin to control for confounders across your studies and start your virtual study!
Don’t have data from additional studies? Use the Cosmos-Hub Atlas to incorporate new datasets into your study and increase the statistical power of your study.
The Cosmos-Hub platform provides a univariate statistics workflow that enables users to conduct customizable pairwise comparative analyses of up to 24 cohorts to reveal statistical testing figures and visualizations.
Users have the flexibility to switch between different databases and metrics that have been run with a click of the button, easing the interpretation of the data. The outputs are interactive and exportable in a number of different formats including CSV data or PNG/SVG/PDF image formats.
Finally, when it’s time to publish, you can access each comparative analysis you’ve created in the main study dashboard where you will be able to access the methods and which parameters were used so that you or a peer can always reproduce the results.
Browse sample distributions, identify outliers, and pin specific organisms of interest. This functional table allows you to switch between taxonomic levels (e.g., Phylum vs. Species) to identify trends, such as the characteristic increase in the to ratio often observed in obesity, or specific pathogen blooms in dysbiosis.
Manipulate hierarchical clustering and color palettes in real-time to visualize complex abundance patterns. This tool is essential for spotting broad compositional shifts, such as the distinct microbial signatures found in patients with Inflammatory Bowel Disease (IBD) compared to healthy controls.
Aggregate results by cohort to visualize community structure at a glance. Sort and order features to highlight dominant taxa, such as the prevalence of in healthy infants versus the shift toward in elderly populations.
Utilize the Wilcoxon Rank-Sum test to determine statistical differences in specific organisms or functional pathways. This tool is critical for identifying differentially abundant taxa, such as the depletion of butyrate-producing in Type 2 Diabetes or the enrichment of in colorectal cancer tissues.
Reveal feature similarity across samples in 2D and 3D formats, allowing you to visually assess how distinct experimental groups are based on their overall microbial composition.
Select from metrics like Chao1, Simpson, or Shannon Diversity indices with integrated statistical testing. Alpha diversity is a key indicator of gut health; for instance, reduced diversity is a hallmark of conditions like recurrent infection and IBD, while higher diversity is often associated with high-fiber "Mediterranean" diets.
Explore microbiome trajectories using PCoA plots (Jaccard, Bray-Curtis) and test for significance with PERMANOVA. This analysis is vital for visualizing community-wide shifts, such as the profound changes in gut microbiota composition induced by Western diets compared to agrarian diets.
Published by the Huttenhower lab at Harvard University in 2010, LEfSe determines the features (taxa or functions) most likely to explain differences between cohorts when compared in a pairwise manner. LEfSe helps discover robust biomarkers, such as distinguishing the microbial signatures of responders vs. non-responders in cancer immunotherapy.
Move beyond simple comparisons with Cosmos-Hub’s multivariate statistics, designed for personalized and complex study designs. These tools allow you to incorporate continuous metadata variables, control for critical confounders (such as age, BMI, or antibiotic usage), and perform linear regression analyses. This capability is crucial for distinguishing disease-specific signals from variation caused by external factors like medication.
Color-coded matrix that visually summarizes the strength and direction of associations between multiple metadata variables (e.g., nutrient intake, blood metabolites) and microbial features, making it easy to spot clusters of significant relationships.
Display the distribution of microbial feature abundances against metadata categories or continuous variables. These plots allow users to visualize individual associations in detail, such as the correlation between abundance and specific metadata variables (i.e., treatment vs. control).
Quickly identify features with both strong effect sizes (fold change) and high statistical significance, streamlining the discovery of candidate biomarkers for diagnostic or therapeutic targeting.
Visualize effect sizes and confidence intervals for significant associations. This view allows for the easy comparison of the magnitude and reliability of effects across multiple features and metadata contrasts, essential for robust reporting in clinical studies.
All analysis pipelines are version-controlled, ensuring that your results are standardized and fully reproducible across your team and for peer review.
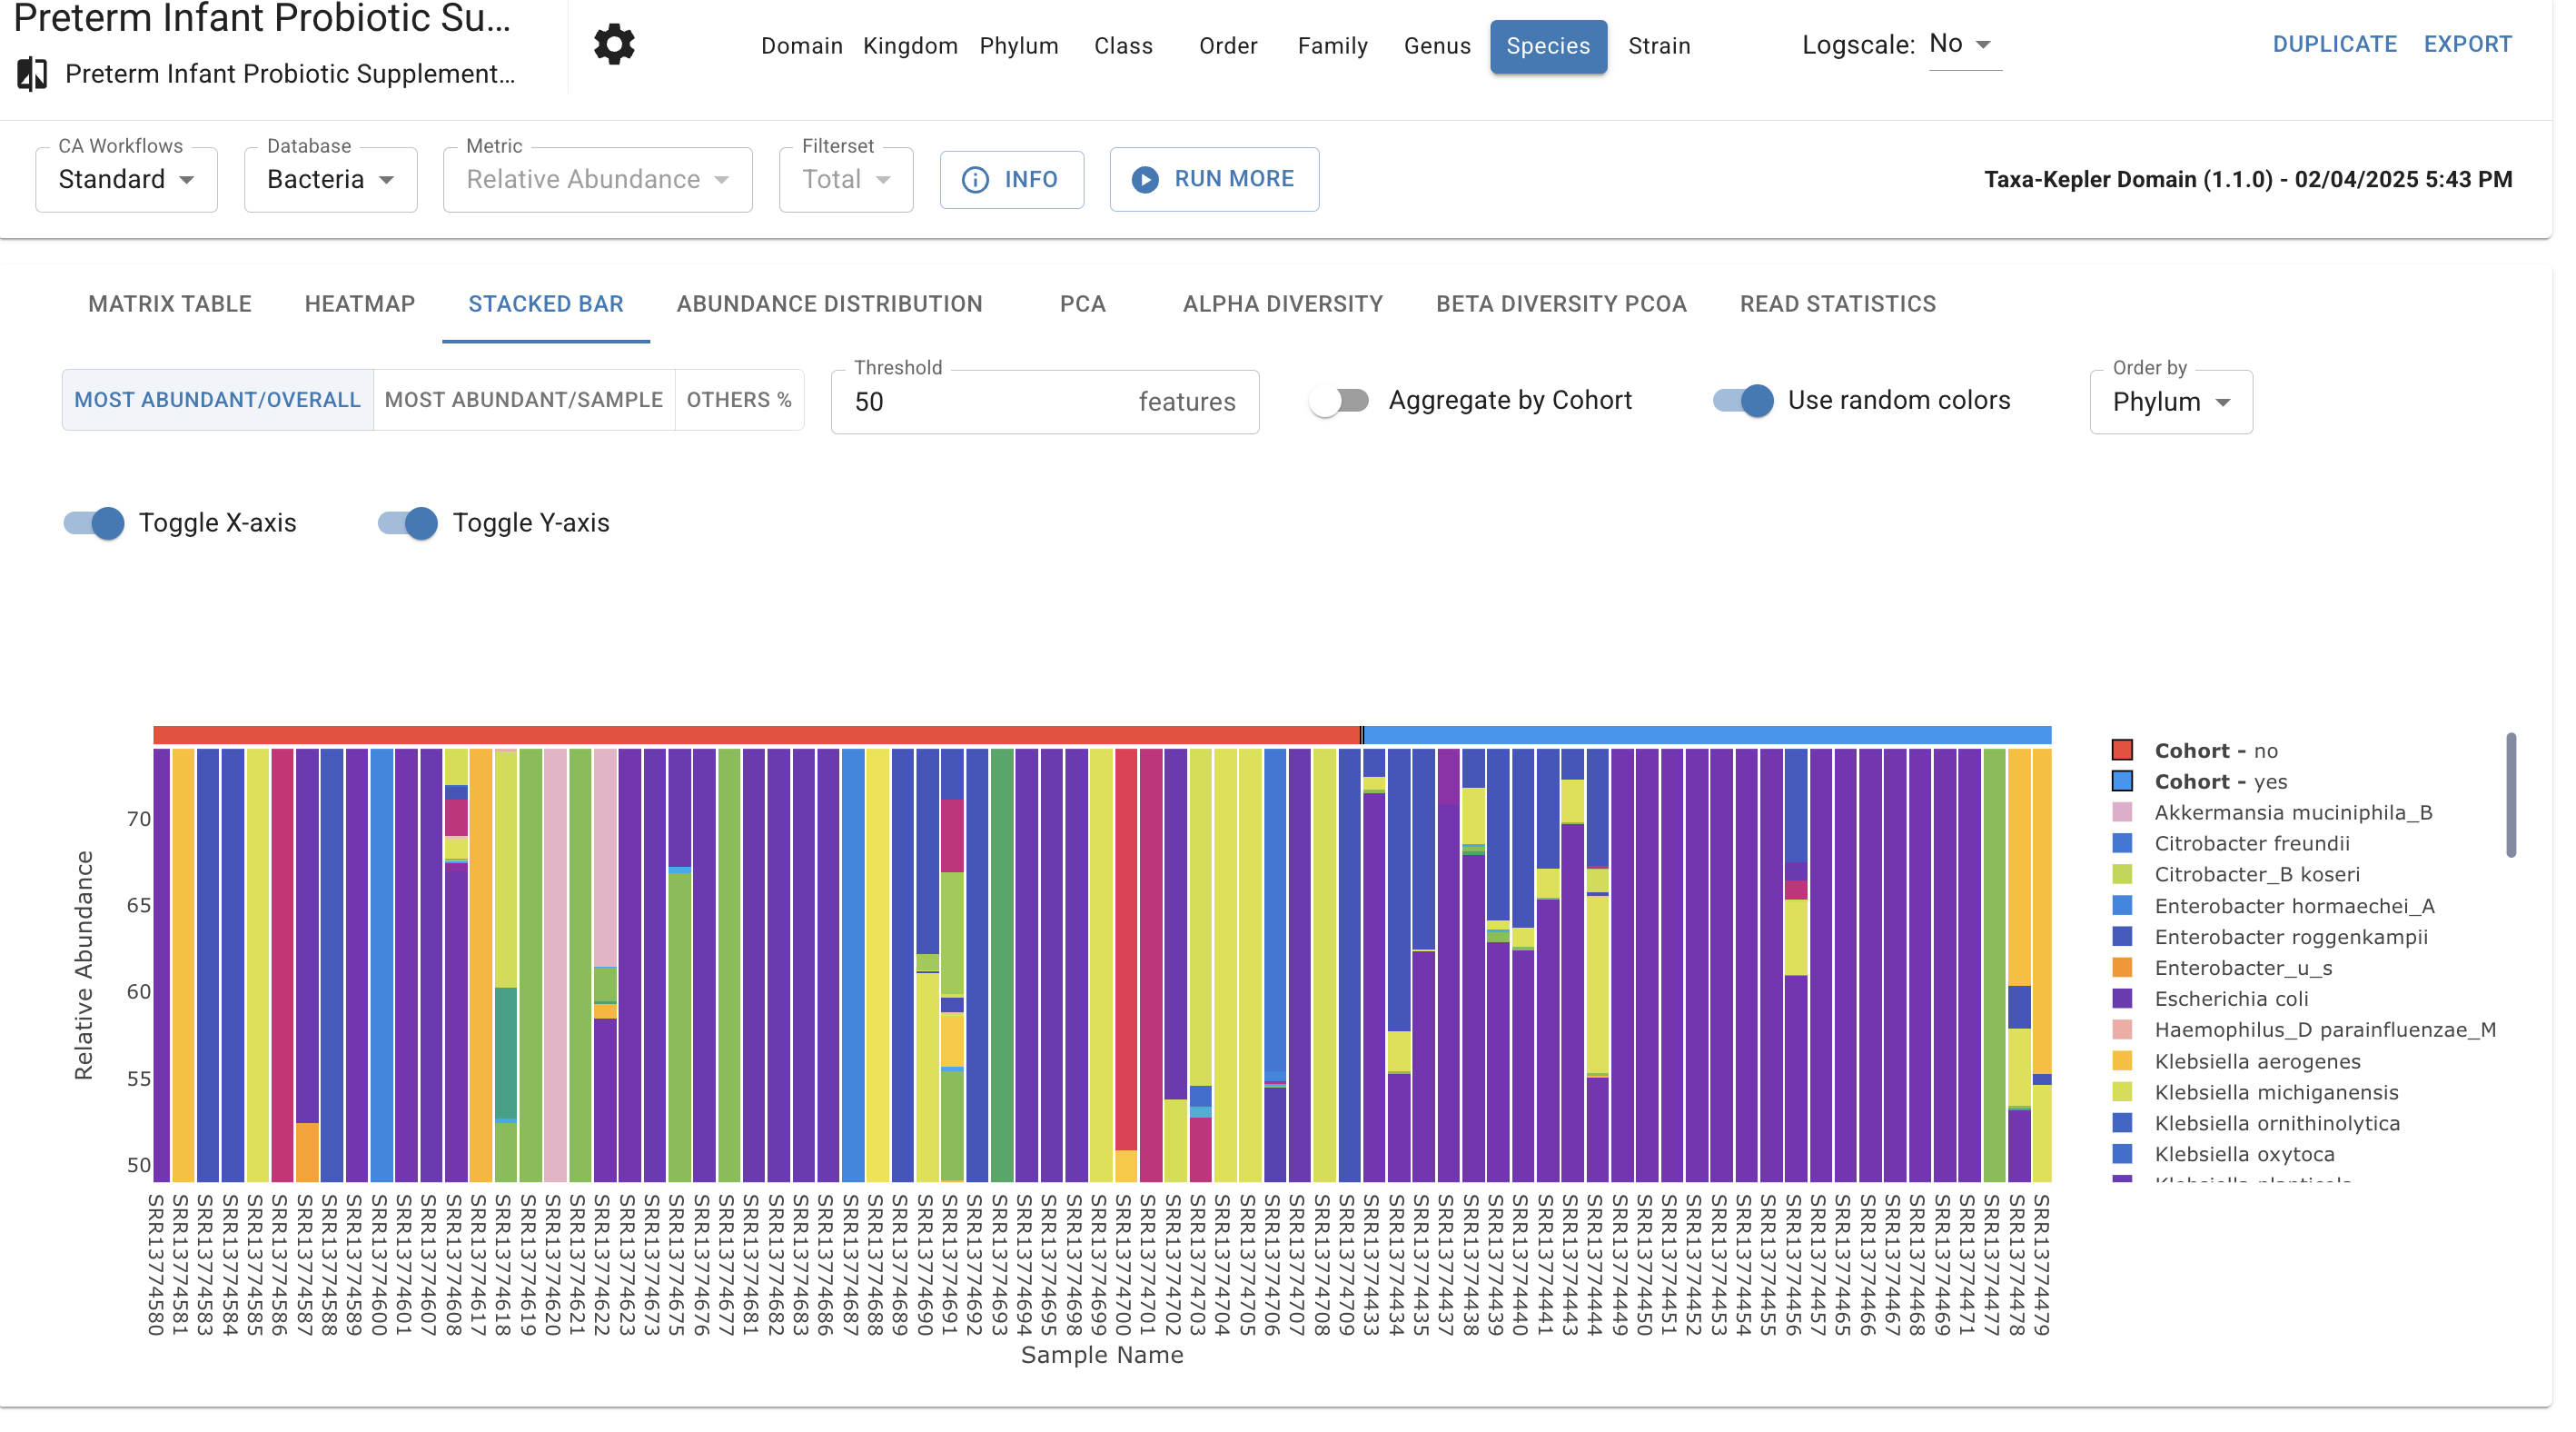
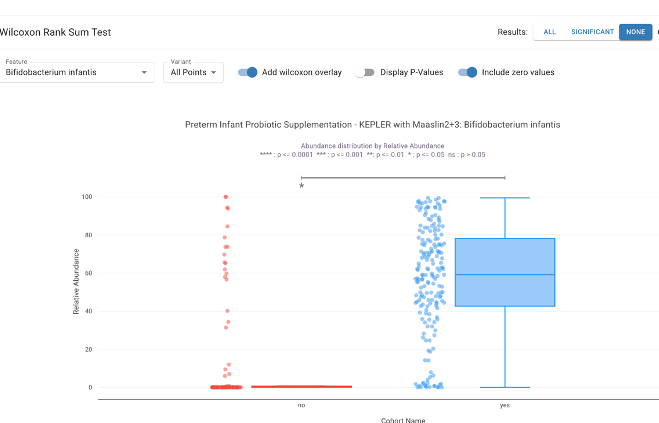
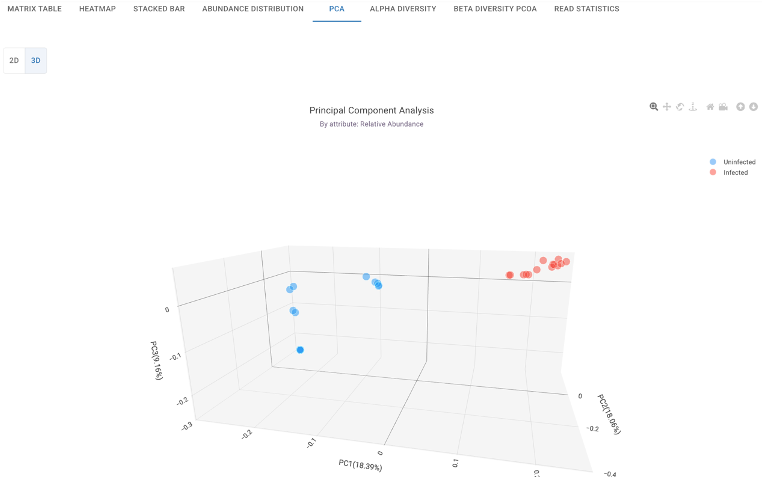
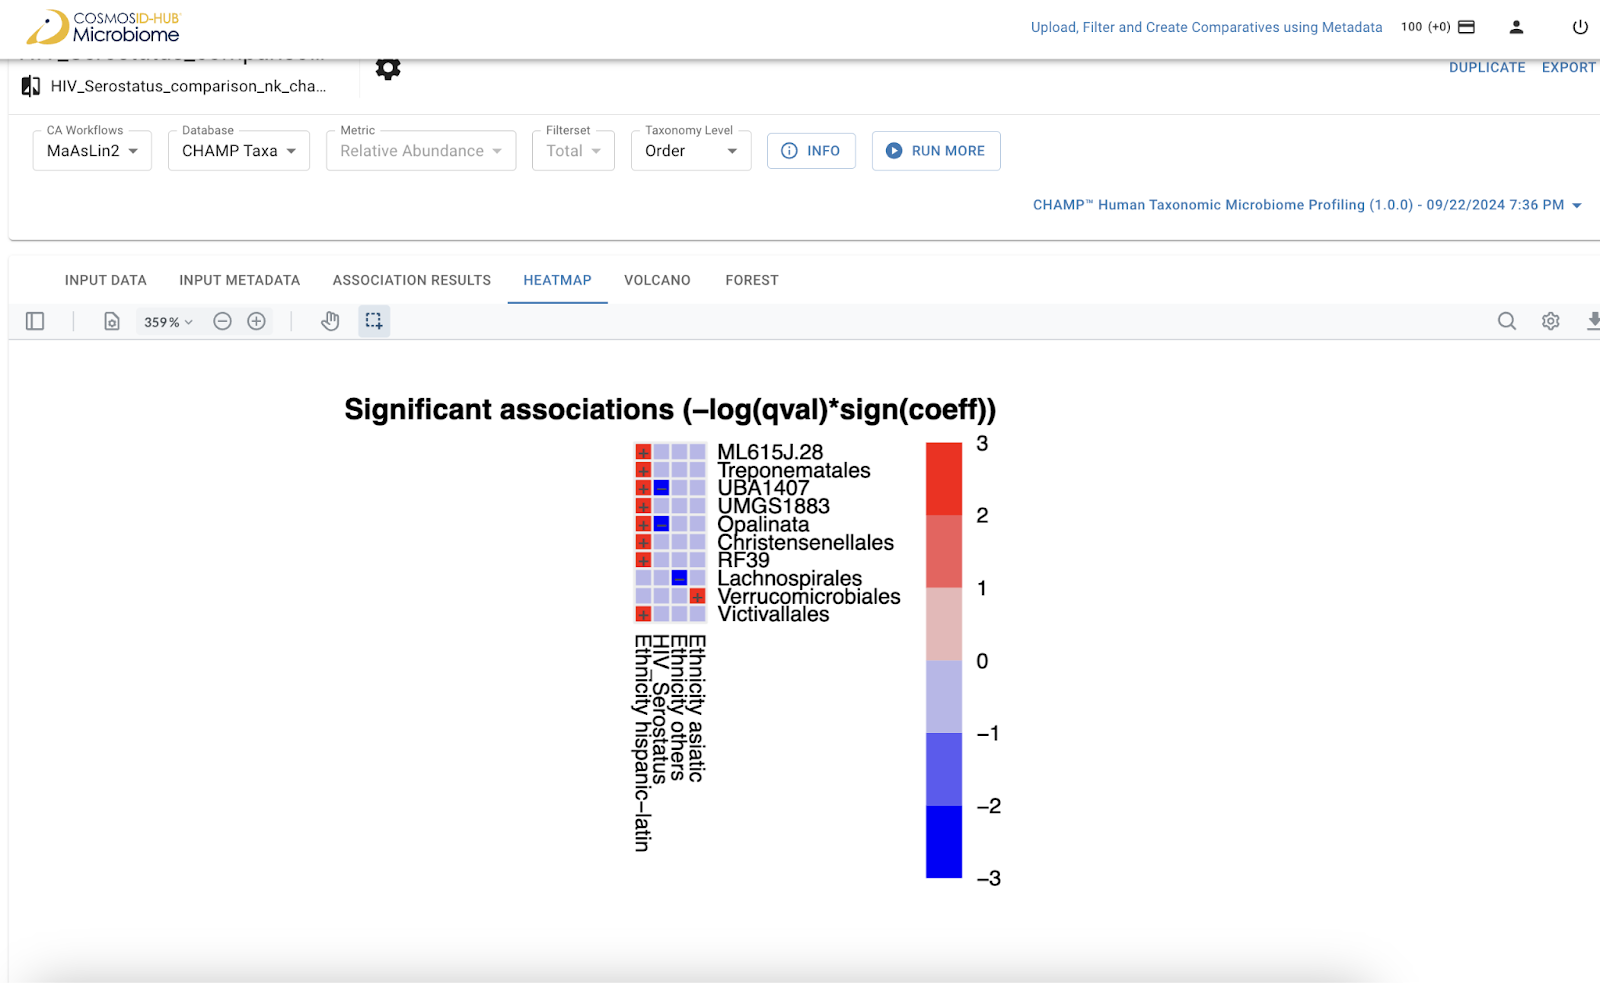
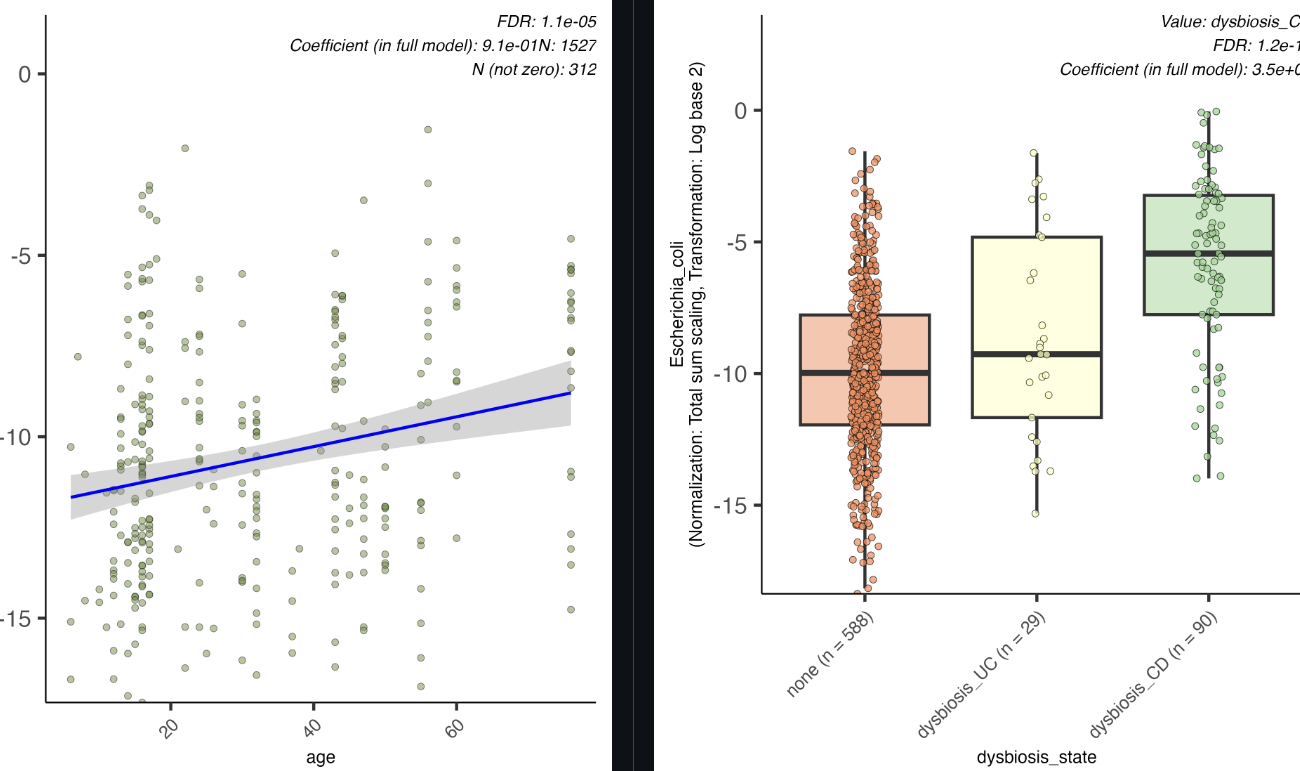
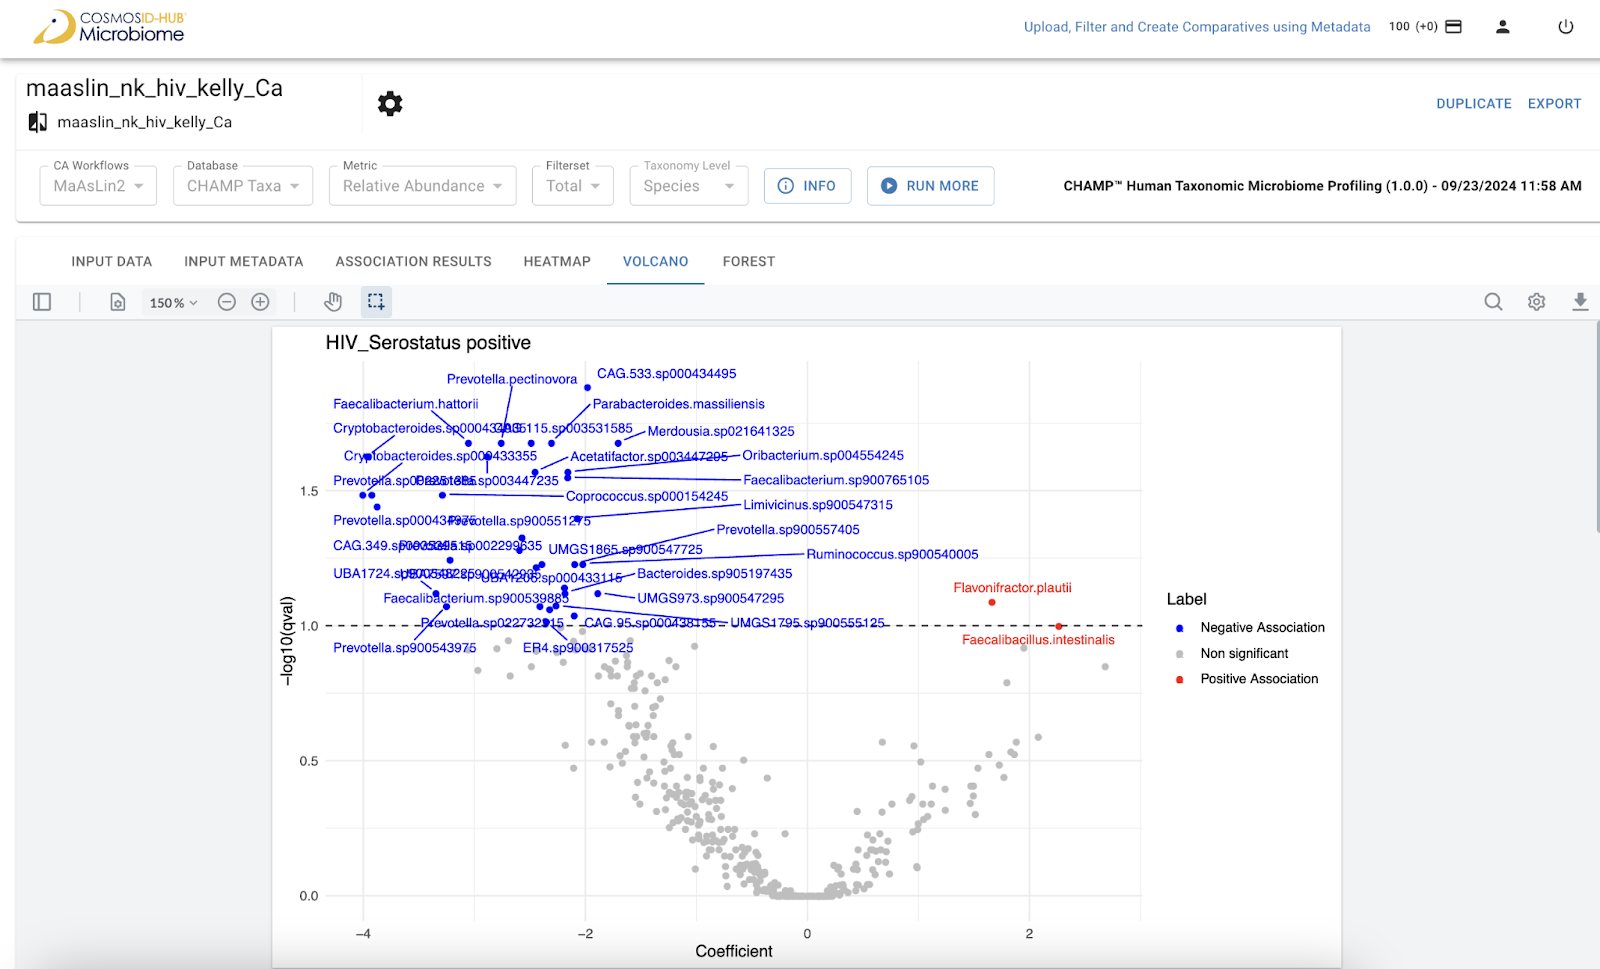
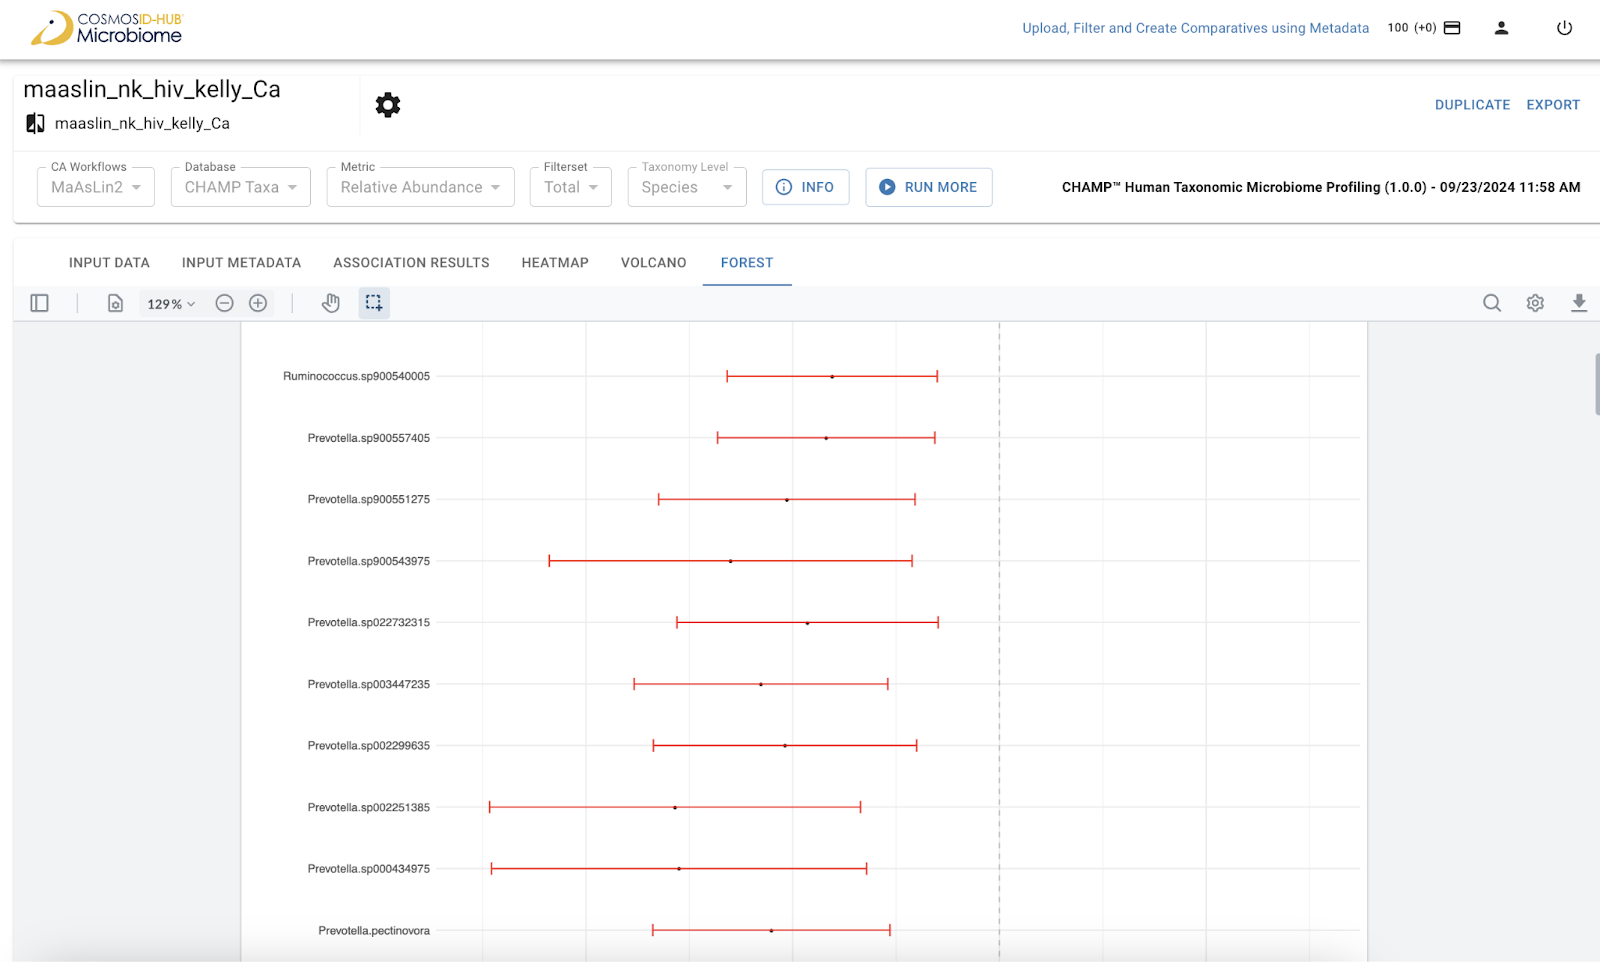
Execute advanced statistical workflows, including taxonomic/functional profilers and advanced tools like MaAsLin3 for differential abundance, without writing a single line of code.
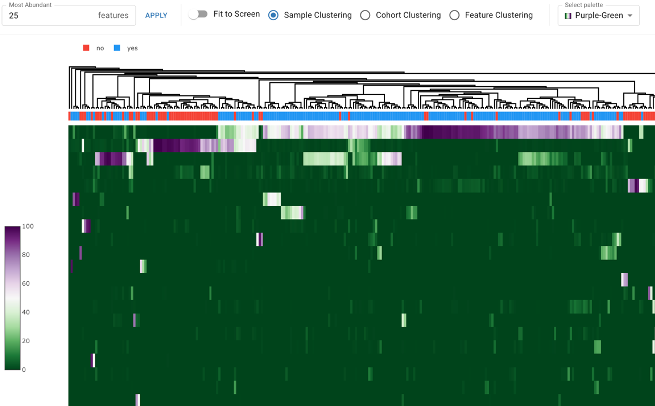
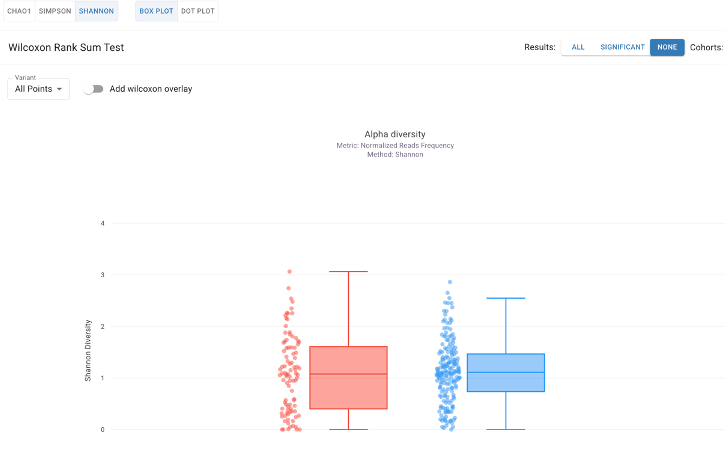
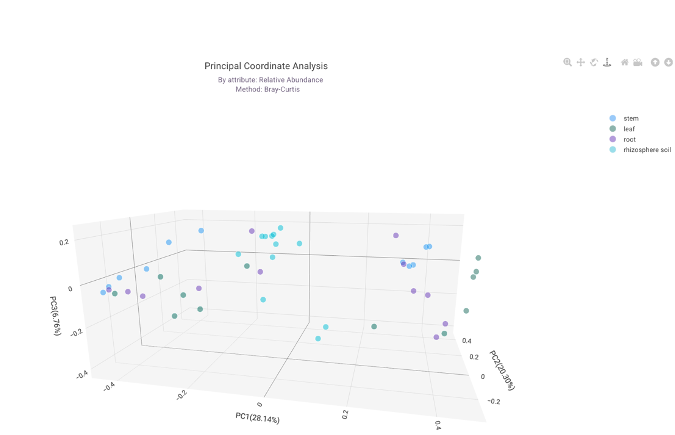
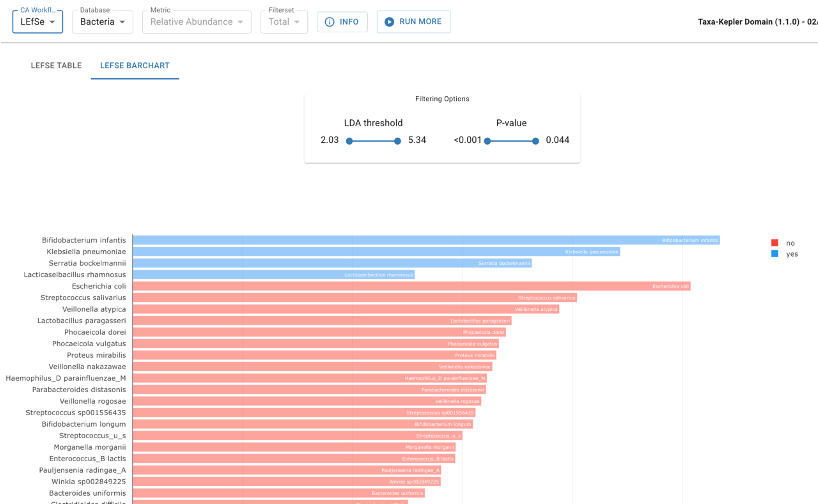
Manipulate figures in real-time to uncover hidden insights and generate publication-ready graphics that clearly communicate complex microbiome data.
Leverage scalable, secure cloud computing to handle large datasets without the need for specialized local hardware, saving costs on on servers and specialized machines. All you need is an internet connection and Google Chrome. That's it!
Generate comparative analyses and statistics in minutes rather than hours, accelerating the timeline from raw data to published discovery.
Contact us today to learn how Cosmos-HUB can enhance your microbiome research with virtual cohort analysis.