
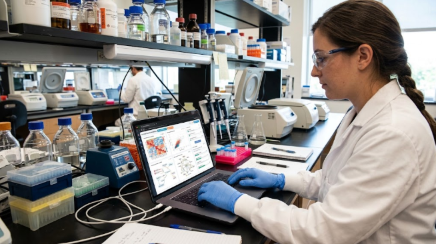
No-code bioinformatics lets a bench scientist run standard omics analysis, such as normalization, calculating diversity metrics, ordinations and differential testing, through forms and menus of an intuitive graphical interface instead of R or Python scripts.
If you are a wet lab scientist who generates omics data but does not code, you can now take routine questions on a well-designed study from raw sequencing files to a publication-ready figure yourself, without joining the bioinformatics queue.
The catch is that no-code removes the code, not the statistics. The same choices about filtering, tests and multiple-testing correction still decide whether your result holds up. By the end of this page you will know which analyses are safe to run yourself, what to check before you click Run, and when to hand over to a bioinformatician.
Waiting for analysis has a measurable cost. Bench scientist's main bottleneck is waiting weeks for analysis and being unable to explore data independently, because the usual workflow demands UNIX experience, custom scripts and an experienced statistician.
In a survey of 704 NSF-funded principal investigators, 89% said they needed training to integrate multiple data types, and a majority said their institutions were not meeting 9 of the 13 data analysis needs assessed (Barone et al., PLOS Computational Biology, 2017). Where bioinformatics services do exist, they are stretched and billed: small core facilities in a 2020 survey named staffing shortages as their most pressing challenge and charged internal users an average of $79 an hour (Dragon et al., Journal of Biomolecular Techniques, 2020).
Researchers already working this way report the same shift. Nezar Al-Hebshi, PhD, at Temple University, credits Cosmos-Hub's "ease of data handling and versatility of tools available, including LEfSe and MaAsLin3" with cutting the time he needs to run analysis on his own.
Book a demo
What No-Code Bioinformatics Means at the Bench
No-code bioinformatics is the use of software with user-friendly interfaces, such as parameter forms, menus and drag and drop interfaces, to run established bioinformatics tools on your own omics data without writing code. The code still exists. Developers and bioinformaticians wrote and validated it, and the platform exposes the inputs and settings a scientist needs to choose. Your job shifts from writing a single line of R to making sound analytical decisions.
No code platforms for biology fall into three broad groups. Workflow platforms, such as Galaxy and GenePattern put a graphical interface on a large set of analysis tools. Galaxy is a free, open web platform with more than 9,000 tools and over 500,000 registered users on its public servers, where you chain tools into automated workflows and configure each step. General data science tools such as KNIME and Orange offer visual machine learning on any table, with no omics statistics built in. while Cytoscape specializes in visualizing and analyzing biological networks. Purpose-built omics platforms, such as Omics Playground for transcriptomics and proteomics or Cosmos-Hub 2.0 for microbiome and multi-omics studies, ship pre-built templates for the analyses researchers in that field run most often.
No-code tools for human genome and exome sequencing work, such as variant calling across entire genomes, follow different rules and are outside the scope of this page. Multi-omics research combines layers such as genomics, transcriptomics, proteomics and metabolomics, and integrating them helps reveal disease mechanisms and biomarkers. The guidance below covers study designs where the main question is a comparison between groups: microbiome profiles, metabolite levels, and how genes, proteins or microbes differ under specific conditions.
Which Omics Analyses Can You Run Yourself?
On a no-code ‘omics bioinformatic platform, you can run most descriptive and standard comparative omics analyses yourself, including taxonomic profiles, alpha and beta diversity, PERMANOVA and two-group differential abundance, while study design, custom pipelines and new methods still need a bioinformatician. The table below sorts common microbiome and metabolomics analyses by how safe they are to self-serve, what to check before you trust the output, and the point at which to hand over.
|
Analysis |
Run it yourself? |
Check before you trust it |
Hand over when |
|---|---|---|---|
|
Taxonomic profile (stacked bar chart, heatmap) |
Yes |
All samples passed QC and read depth is comparable across groups |
Many samples fail QC or depth differs widely between groups |
|
Alpha diversity and rarefaction curves |
Yes |
Every sample went through the same depth handling or rarefaction |
Groups were sequenced in different runs or batches |
|
Beta diversity (MDS, t-SNE or UMAP ordination) with PERMANOVA |
Yes |
Groups show similar spread on the plot, because PERMANOVA reacts to spread as well as position |
Your design has nested or repeated measures that need a mixed model |
|
Univariate differential abundance (Wilcoxon, Mann-Whitney U, Kruskal-Wallis, LEfSe) |
Yes |
The statistical test fits the study design and multiple-testing correction is applied, and a prevalence filter is set. |
The hit list changes completely between methods |
|
Multivariable association (MaAsLin3) |
Yes, if covariates are recorded |
Confounders such as age, BMI and antibiotic use are in your metadata |
Random effects or time series go beyond what the form allows |
|
Predictive models (Random Forest, logistic regression, SVM, gradient boosting) |
With care |
Enough samples per class and results reported on held-out data |
You plan to claim a diagnostic or predictive biomarker |
|
Metabolomics secondary analysis on a feature table |
Yes, on processed tables |
Normalization and missing-value handling are documented |
Raw spectra still need peak picking or annotation |
|
New pipeline, custom method or cross-omics integration model |
No |
Not applicable |
Always: this is bioinformatician work |
The rule of thumb: if the method is established, the parameters are visible and your design is a straightforward comparison, run it yourself. If the design is complex or the claim is strong, involve a bioinformatician early, ideally before samples go to sequencing. That split keeps routine data analysis off the queue and saves the team's valuable time for the work only they can do.
A Five-Point Pre-Flight Checklist Before You Click Run
Five checks, completed before you open the analysis menu, prevent most self-service bioinformatics mistakes: clean metadata, adequate group sizes, recorded confounders, a test chosen in advance, and a prevalence filter. Each takes minutes, and none needs code.
- Clean your metadata file. Use one row per sample, one consistent label per group and no merged cells or free-text variations such as "Ctrl" and "control". Enterprise teams on Cosmos-Hub 2.0 can set a controlled metadata vocabulary so labels stay consistent across studies. Group wide numeric ranges, such as ages 0 to 60, into categories before comparing.
- Confirm your group sizes. Small groups produce unstable p-values in any software, so count samples per cohort before testing. If a cohort is small, the licensed Cmbio Atlas, a harmonized database of 150,000+ microbiome samples with metadata, can add comparable reference samples to boost statistical power.
- Record your confounders. Age, BMI and antibiotic use all change microbiome composition, and a multivariable model can only adjust for variables that exist in your metadata.
- Choose the test and correction before you look. Write down which differential abundance method and false discovery rate correction you will report, then run it. Switching methods after seeing results is how false hits get published.
- Set a prevalence filter. Filter out features present in fewer than 10% of samples before testing, as recommended by the 38-dataset benchmark described in the next section.
Why Your Choice of Test Changes the Answer
Your choice of differential abundance test changes which features come out as hits, so picking a method after seeing results is the most common way a no-code analysis goes wrong. Nearing et al. (Nature Communications, 2022) ran 14 methods on 38 16S rRNA datasets totaling 9,405 samples. Depending on the method, the mean share of features flagged as differentially abundant ranged from 0.8% to 40.5% on the same data.
The methods also disagreed on which features mattered: on unfiltered data, about 10% of the features flagged by edgeR, and about 10% of those flagged by LEfSe, were found by no other method. The authors found no single best tool. They recommend a consensus approach across several methods, avoiding LEfSe without p-value correction, and treating conservative tools such as ALDEx2 and ANCOM-II as the safer choice, with MaAsLin2 as an option for more statistical power. MaAsLin3, the successor to MaAsLin2, was released after that benchmark.
A hit that appears under two methods with correction is worth a figure. A hit that appears under one method only is worth a conversation with a bioinformatician.
No-code tools make the consensus approach cheap. Running LEfSe with correction and a MaAsLin3 model on the same cohorts takes a few clicks, so there is no reason to report a single method's output alone.
Worked Example: Comparing Two Cohorts in Cosmos-Hub 2.0
A two-cohort microbiome comparison in Cosmos-Hub 2.0 takes six steps: upload reads, attach metadata, run a profiling pipeline, define cohorts, run the statistics, and export figures. The platform is used by 1,000+ researchers in 30+ countries, who have profiled 600,000+ samples and run 170,000+ analyses on it. The example below is illustrative, not a client study: a scientist comparing 16S stool profiles from two diet groups of 20 participants each, with age, BMI and recent antibiotic use recorded.
Getting Your Omics Data Into the Platform
Cosmos-Hub 2.0 accepts two kinds of input. Raw shotgun metagenomic and 16S/ITS amplicon reads run through its no-code profiling pipelines, which include CHAMP, Kepler, DADA2-based short-read amplicon profiling and EMU-based long-read amplicon profiling.
On Cosmos-Hub 2.0, you can upload custom feature tables for metagenomics, metatranscriptomics, metabolomics and proteomics upload directly, so if you already profiled your data with another pipeline, you bring in the profiled output instead. The platform runs in the cloud on Amazon Web Services, with your data indexed in a secure data lake and enterprise-level scaling for concurrent users, so there is no local server to set up.
Attach your metadata, choose a profiling workflow, and move on to cohorts.
Running the Statistics Without Writing Code
The Cosmos-Hub statistics toolbox in version 2.0 offers 40+ flexible, version-controlled statistical analysis tools in a no-code format. Define the two cohorts from the diet field in your metadata, then work through the analysis in order:
- Check the taxonomic profile in a heatmap and stacked bar chart for outlier samples.
- Compare alpha diversity between the diet groups and check the rarefaction curves.
- Plot beta diversity as an MDS ordination and read the PERMANOVA result alongside the spread of each group to see whether the microbial communities differ overall.
- Run a Univariate comparison with Mann-Whitney U test with multiple-testing correction for a first list of candidate taxa.
- Fit a MaAsLin3 model with diet as the main variable and age, BMI and antibiotic use as covariates.
- Keep the taxa that both methods flag, and save the analysis as a snapshot for review.
In the Cosmos-Hub Studio, you iterate on statistical parameters, customize figures and save snapshots from a control panel, and the output updates without a new request to anyone. Saved analyses keep a history log and can be shared in Hub Workspaces, so colleagues with different technical skills see the same study. Because the analysis tools are version-controlled, a rerun with the same settings gives the same result.
Producing Publication-Ready Figures
Cosmos-Hub 2.0 creates publication-ready visualizations and standardized reporting assets without coding. Each saved analysis records the methods and parameters behind it, which gives you what you need for the methods section of a paper or grant report.
Where an AI Co-Pilot Helps, and Where It Does Not
An AI co-pilot speeds up the reading and reasoning around an omics analysis, such as finding papers on a taxon or framing a hypothesis, but it does not check your statistics for you. The RITA AI Microbiome Co-Pilot in Cosmos-Hub answers questions about taxa and their functions, links between the microbiome and disease, and statistical models, and returns references with links to PubMed and open-access sources. Cosmos-Hub 2.0 also adds AI-powered natural-language queries, so you can ask questions of your data in plain English.
Use the co-pilot to turn a list of hits into biological information you can act on: what a taxon is known to do, which regulatory mechanisms or complex interactions in biological systems have been reported, and which papers to read next. Open every referenced paper before you cite it, and keep the decisions about filters, tests and corrections with you or your bioinformatician.
How to Choose a No-Code Bioinformatics Platform
Choose a no-code bioinformatics platform by checking six things: the different omics data types it supports, whether you can see its methods and parameters, how it handles reproducibility, its export formats, its collaboration and governance features, and how hand-offs to bioinformaticians work. The comparison below covers four common options for researchers without a coding background.
|
Option |
Best fit |
Data types |
Trade-off |
|---|---|---|---|
|
Galaxy |
Free, flexible automated workflows |
Broad: over 9,000 tools across genomics, transcriptomics and more |
More setup and learning time |
|
KNIME or Orange |
Visual data processing and machine learning on any table |
Any tabular data |
Less tailored to omics |
|
Omics Playground |
Exploring transcriptomics and proteomics results |
Transcriptomics, proteomics |
Narrower focus |
|
Cosmos-Hub 2.0 |
Microbiome and multi-omics group comparisons with 40+ version-controlled statistical tools |
16S/ITS and shotgun reads; feature tables for metagenomics, metatranscriptomics, metabolomics and proteomics |
Commercial subscription |
Every no-code platform trades some flexibility for ease of use: pre-built modules cover common analyses well but restrict customization for specialized ones, and that limit is the point to bring in a bioinformatician. Free trials and pilots are the quickest way to judge whether a platform suits your data. Ask any vendor for a live run on your own data type rather than a demo dataset, or ask for a pilot: Cosmos-Hub 2.0 onboarding starts with a pilot phase built around your priority use cases and datasets. A platform that hides its parameters or cannot tell you which version of a method it ran will make your methods section harder to write and your result harder to defend.
Your Next Step
Pick one dataset already sitting on your drive and run it through the five-point checklist above. If the metadata is clean, the groups are large enough and your test is written down, it is a good candidate for your first self-service analysis. Explore the Cosmos-Hub statistics toolbox to see which methods cover your study, or book a demo and ask to see the workflow on your own omics data.
Book a demo
Questions Bench Scientists Ask About No-Code Bioinformatics
Is coding necessary for bioinformatics?
Coding is not necessary to run established bioinformatics analyses on a standard study design, but it is still necessary to build new pipelines, develop methods or integrate omics layers in custom models. Training in R or Python helps you read methods sections and talk to bioinformaticians, and no-code platforms remove the need to write the code yourself.
Will AI replace bioinformaticians?
AI assistants and no-code platforms are not replacing bioinformaticians; they take routine reruns and figure requests off their desks. Study design, method validation, quality review and new analysis development still need a trained bioinformatician.
Can I publish results from a no-code platform?
You can publish results from a no-code platform when you report the software, its version, the methods and the parameters, exactly as you would for scripted analysis. Version-controlled pipelines and a recorded parameter history make that reporting complete.